Startup People vs. Big Company People

Startup people are all about creating results. Big company people are all about scaling processes.

Startup people are intrinsically motivated. Big company people are motivated with incentives.

Startup people thrive in chaotic flat environments. Big company people thrive in hierarchy and structured environments.

Startup people are generalists in nature. Big company people are specialists in nature.

Startup people do whatever it takes to get the job done. Big company people need prior training and experience to get the job done.

Startup people have to do everything because there is no one else to fall back on. Big company people focus on the high level work and leave the low level details to their staff.

Startup people are comfortable with uncertainty and volatility. Big company people need stability.

Robinhood S-1 Teardown

My review of Robinhood’s S-1 & IPO including revenue, customers, product segments, shareholders, and the company’s key metrics.

Company Overview

  • Robinhood, the fintech brokerage app, released their S-1 and will be going public with the ticker HOOD.

  • Robinhood raised $5.6B in the private markets from DST, Ribbit Capital, NEA, and others. 

  • Founded in 2013, Robinhood is one of the fastest growing fintech companies with a ~$2B annualized revenue run-rate based on their Q1 2021 metrics. 

  • Robinhood is targeting a $40B valuation at IPO which is 40x their 2020 annual revenue run-rate. 

Key Metrics

  • Robinhood has 18M total funded accounts, of which 17.7 are monthly active users (MAU).

  • Robinhood is generating $959M in revenue in 2020, which is a 245% growth rate compared to 2019.

  • Robinhood has $81B of assets under custody including equities, options, cash, and cryptocurrencies.

Revenue

  • Robinhood did $959M in revenue for 2020, and $278M in revenue in 2019. 

  • For 2021 they are doing a forward looking revenue run rate of ~$2B based on $522 million revenue for the first three months of 2021.

  • The biggest drivers of Robinhood’s revenue include: 

    • 80% of their revenue is generated through payment for order flow and other transaction fees.

    • 12% of their revenue is generated through net interest margin on idle cash.

    • 8% of their revenue is generated through Robinhood Gold (premium accounts)

  • While not the fastest growing segment, options make up a disproportionate % of transaction revenue of 38% of all transaction revenue. 

robinhood chart 1.jpeg

Customers

  • Today Robinhood has 18M funded accounts, in 2020 they had 12.5M accounts, and in 2019 they had 5M accounts.

  • This is a 143% increase between the full year of 2019 to 2020.

  • Their average revenue per user (ARPU) is $137

robinhood active.jpeg

Product Segments

  • Robinhood's core products include their trading platform, crypto trading, and cash management. With their retail brokerage and crypto trading making up the vast majority of all of the revenue for Robinhood. 

  • The fastest growing product segments of Robinhood (by transaction revenue) are:

  • Crypto, which is growing 1,967%

  • Equities, which is growing 322%

  • Options, which is growing 231%

  • Robinhood has $81B of assets under custody including:

    • Equities - $65B

    • Options - $2B

    • Crypto - $11.5B

    • Cash - $7.6B

    • Margin - $5B

Screen Shot 2021-07-01 at 2.48.40 PM.png

Robinhood Crypto

  • In Q1 2021, 9.5M Robinhood customers traded $88B of crypto on the platform. 

  • Robinhood is holding ~$12B of crypto assets which is a 23x fold increase from 2020.

  • 34% of all of their crypto revenue was attributable to Dogecoin. 

Shareholders

  • The biggest shareholders of Robinhood (own more than 5% of the stock) include: DST Global, Index Ventures, New Enterprise Associates, and Ribbit Capital

Now is the time to act

Below is part of a memo we sent out to our portfolio companies for Proof of Capital. Sharing it publicly here for the benefit of other entrepreneurs and founders in the technology sector:

On March 12th, 2020 the stock market fell 10%, suffering its worst day since the Black Monday crash of 1987. In the first few months of 2020 the market has almost lost all of its gains across all of 2019.

Stock Crash.png

When I first moved to Silicon Valley in 2008, the world was in the depths of the global financial crisis. Housing prices were at an all time low, downtown Palo Alto was half empty, uncertainty was rampant, and the top venture capital funds were telling entrepreneurs RIP the good times are over.

Amidst all of this volatility in 2008 the arc of technology continued, founders persevered. And despite the collapse of all assets, a few of the most valuable early stage companies were forged during this time period including: Lyft, Credit Karma, Twilio, Slack, Dropbox, etc. 

Now is the time to act

The black swan event of the decade is already upon us, COVID-19 or more commonly referred to as the coronavirus. This post isn’t a recap of what happened, it’s about what to do next, especially for founders & CEO’s of startup companies. 

As with all major shifts in the environment, this one will offer opportunities as well as risks. While we predict this downturn may be shallower than the 2008 financial crisis, it could potentially progress on a much lengthier timescale.

With more and more countries closing off their borders and consumers pausing economic activity - this will have massive downwards pressure on spending across the board. As a founder, now is the time to make decisive actions for the future of your company & employees.

Below I will cover:

  • Why now is the time to act 

  • Tactical tips CEO’s can do now

  • My viewpoints on the effects across various industries 

  • Final Thoughts

Why now is the time to act

Unlike the 2008 financial crisis caused by an overleveraged housing market, this crisis is due to a global pandemic, the COVID-19 virus.

We cannot inflate ourselves out of this problem, cutting interest rates to 0% will not help, stimulus will not work, and there are no easy quick fixes. This is a global health problem, that is causing an economic problem. The best thing to do to solve the underlying problem is containment. We need to shut down all face-to-face interactions and in-person activities to slow the spread of the virus, in which the consequences of this will wreak havoc on the economy.

China is the closest comparable to fully understand how long this could affect the US economy. China had its first case of the coronavirus in November 2019 and is only now coming back to normality in March 2020 (5 months later). 

For the United States, if we take the necessary measures I predict we will start reactivating back to normal business activity around Q4 of 2020. Until then expect a challenging Q2 and Q3. 

Cumulative cases.png

Data is from the Johns Hopkins University Center for Systems Science and Engineering (JHU CSSE)
(Note: There is limited data from the
first reported case in China until today. Above is an approximation based on the R0 value as observed)

On top of this, I also predict that this crisis will lead towards more longer term structural trends and changes in consumer behavior & workplace behavior. A few examples: work will increasingly become more remote, eSports and gaming will grow even more in demand, financial services will turn radically more digital, etc. 

This will be a defining event for consumers and businesses around the globe, and we should expect real long term changes as a consequence of this event.

Tactical Tips CEO’s Can Do Now

Below are a few practical tips you can start doing now from a strategic standpoint and company operational standpoint: 

Overall Company Strategy

People

Taking care of your team and having clear communication about your plan is of utmost importance. 

  • Make sure all managers can clearly communicate work from home policy, sick leave policy, and vacation policy to all team members.

  • This includes all of your team members including part time employees, temporary staff, interns, and contract employees. 

  • Here is an example of a company’s (Handshake) internal communication about their changes to internal policy for employees

  • For parents working at home with seniors and children present, be sure to be flexible and understanding.

  • If you need to make hard decisions regarding your team, make sure to handle them directly and clearly with every person individually. 

Finance 

  • Cash is the most important resource for you to manage  - The most impactful thing CEO’s can do now is to cut your company’s net burn rate (the dollar amount your startup spends per month, in excess of revenue). A few benchmarks:

    • Early Stage Companies - Should keep monthly burn at $50K or lower

    • Pre-Product Market Fit - Should keep monthly burn at $100K or lower

    • Post-Product Market Fit - Should keep monthly burn at $20K per month per team member (fully burdened) or lower.

  • Review all expenses - Cut out any unnecessary expenses, downsize to a smaller office, renegotiate long term leases, review all software expenses, etc. Act now and focus on the things that matter. 

  • Monitor Runway - Ideally CEO’s should strive to have 18 months or more of runway. (Total cash on hand / monthly net burn rate = Months of runway left). If you have less than 6 months of runway you need to seriously consider a fundraise or bridge round now.

  • Analyze and adjust revenue goals - Consumer and business spending will likely slow substantially across the board, so now is the time to analyze your short and long term revenue goals and customer pipeline (see “Sales” section below). 

  • Have a realistic fundraising plan

    • Start getting comfortable pitching via Zoom and video calls. Building rapport and trust is more difficult than doing so in-person but this will be the new reality for a while.

    • Be prepared for the fundraising process to take twice or three times as long. For example if you expected a 3 month fundraising, expect 6 months+ for now (this varies depends on your vertical).

    • Because of the increase in length, ask all potential investors if it's ok to add them on your company update. The best thing to do is to show investors how you weather the storm.

    • Update your existing investors and ask for help.  Clearly communicate your adjusted quarterly and yearly  revenue goals, customers, pipeline, burn rate, and other company metrics. 

    • Be prepared for a decrease in valuations. The reality is many companies will potentially need to do bridge rounds to get them through this period.

Product/Engineering

CEO’s should have a frank conversation with head of product and engineering on the following:

  • Adjust product roadmap - Need to account for a decrease in productivity (working from home with kids, etc.), adjusting to new work environments, and rapidly put processes in place for the team to work remotely and get back to efficiencies quickly. You need to be realistic on what your team can achieve and be ready to extend timelines on initiatives.

  • Leave room for urgent features that need to be built. For example: 

Marketing 

  • Adjust marketing and advertising budget, based on lowered demand.

  • Analyze customer lifetime values (LTV) and adjust minimum return on investment (ROI’s) of advertising spend.

  • Review all upcoming marketing campaigns and adjust your overall marketing goals based on your updated revenue goals.

Sales 

  • For B2B companies - establish remote selling tools for your salesforce. 

  • Adjust customer and sales pipeline: 

  • Current Customers

    • Revenue Concentration - Look at your revenue concentration across your top customers. Ideally no one customer should be more than ~5% of the total revenue.

    • Triaging customers - This slowdown will be unevenly distributed so you need to triage your customers into a few buckets: 

      • Unaffected and strong industries - For the customers in strong industries (future of work, gaming, ecommerce) - try to move these customers to annual contracts and even consider sales expansion for the most positively affected customers. 

      • Weak industries - For the customers in weak industries (travel, restaurants, luxury goods) you will need to heavily discount their revenue contribution. It might sound counterintuitive but the best strategy could be to give the hardest hit customers discounts or deferred payments to win their trust long term.

      • Startup customers - If your customer base is largely other startups, these customers tend to be hit the hardest during times of recession. I would expect a large portion of these customers will now renew customer contracts.

    • Customer Pipeline

      • Expect your time to close to increase substantially. A conservative estimate is it will now take 2x as long (ex. If your time to close was 3 months, expect 6 months now).

      • Expect average contract values (ACV) to decrease. You can use a similar triaging exercise as above to triage the customers within your pipeline.

      • Start adapting to the new realities of sales - digital selling, video calls (not in-person meetings), longer trials, more self service, etc.

Support

  • Customer care is job number one. This is the time where you earn long term customer loyalty, and when you ask your customer support and customer success team to step up, even if it means sacrificing some near term revenue. 

  • Enable remote support communicate tools (with customers and between support team members) 

  • Review customer escalation process. If your company serves customers in hard hit industries (travel, restaurants, etc.) you need to be able to process special accommodations. For example:

Partnerships

  • Now is the time to focus on the partners who are with you for the long haul.

  • Adjust partnership roadmap and timeline. Be realistic on the value you will derive from your partners, because everyone will be dealing with their own internal channels first. 

  • Encourage your business development team to find new partners that may want to band up to fight this downturn - aligning new interests.

My viewpoints on the effects across various industries

In addition to all of the actionable steps founders & CEO’s should take, here are my own personal viewpoints on how this downturn will affect various industries. 

Consumer spending and business spending will likely slow, although we forecast this to be uneven across various industries and subsectors. This spreadsheet below can help you triage your customers and future second order effects. 

industries 1.png
industries 2.png

Final Thoughts

In times like this it’s important to come together and take care of our entire communities: employees, families, partners, and society at large.

  • Make sure your family, relatives, and loved ones are prepared. Here are some resources from the CDC for home preparedness.

  • For team members with families and kids, be sure to have a lot of patience. Many schools will be canceled and working from home with kids is a real challenge.

  • Be sure to watch after your neighbors and greater community. There will be many people negatively impacted by this virus, and we will all need to come together and help each other out.

This includes helping neighbors pickup groceries, sharing necessity items, and being there for emotional support. It’s times like this where humanity needs to come together and be greater than just ourselves.

We’re all in this together. Be healthy and safe. 

Fintech Infrastructure 101 - Overview & Market Landscape

Financial Technology (“Fintech”) startups are companies targeting all of the core financial applications including Banking ($7T), Wealth Management ($75T), Capital Markets ($74T), Lending ($8T), Real Estate ($8T), Insurance ($5T), Payments ($2T), and Remittances ($800B). 

While diverse in scope, all of these activities are interconnected and largely facilitated through traditional financial institutions including: JP Morgan, Wells Fargo, HSBC, BNP Paribas, MUFG, Bank of America, Bank of China, Industrial & Commercial Bank of China, Citigroup, and many others.

However, many of these new startup fintech startups are being built by developers, who are a very new customer segment for traditional banks and who are changing the needs of the underlying financial infrastructure itself. Before diving into how the infrastructure ecosystem is changing, I will cover the major trends that are the root cause of this change.

Major structural trends in the fintech landscape

  1. Increasing global customer bases

  2. Embedded Fintech

  3. Unbundling of Financial Institutions

  4. Developers as the end customers


Increasing global customer bases

Financial services companies historically have dealt with a limited set of customers across known geographical barriers. Traditional banks started with local, city, regional, state wide, and country-wide offices and worked with international correspondent banks to transfer money across jurisdictions. 

Banks were not set up to handle international customer bases, and the regulatory and compliance overhead of sending international payments is a huge sunk cost within the current system. On average it costs ~7% to send remittance payments internationally between retail customers.

In contrast, digital commerce platforms are required to handle international customer bases from day one. For example:

  • Apple - 1.4B active apple device users across every major continent worldwide. 

  • Airbnb - 650,000 hosts, 150M renters, 2M bookings per day, across 191 countries. 

  • Shopify - 600,000 merchants across 175 countries with $15B in GMV for 2019.

  • Uber - 3M drivers and 75M riders across 80 countries, with $40B in GMV for 2019.

  • Binance - 15M users across 180 countries, with $1T in trading volume on the platform and $1B in cumulative profit in 1.5 years of operation. 

The financial infrastructure platforms of today must be able to handle customers across all jurisdictions, all exchanges of value, all types of use-cases (producers, distributors, consumers), and all from the start.


Embedded Fintech

The financial sector and fintechs have historically been thought of as a vertical industry serving specific use-cases (banking, lending, trading, etc.). However we are now seeing the rise of “embedded fintech.”

Rather than standalone applications, financial features are being embedded into all of the consumer and business applications that people are using already. Here are several examples:

  • Uber - Launching Uber money to allow drivers to collect earnings in real time & issue credit/debit cards to spend their balance. 

  • Grab - Created their own digital wallet to be able to hold and spend value in their digital wallet (similar to WeChat pay). 

  • Google - Now offering checking accounts through Citigroup and Stanford Federal Credit Union.

  • Facebook - Is trying to launch Libra, one of the more ambitious bets to develop their own digital currency. 

  • WeChat (owned by Tencent) - Has 1B users and does $1B in total daily payment transaction volume via WeChat Pay. 

Embedded Fintech.png

Unbundling of Financial Institutions

Financial companies historically were large monolithic applications that served the entire suite of financial products to all of their customers. For example, Wells Fargo provides all of these services across these segments: 

  • Consumer - Checking accounts, savings accounts, debit cards, credit cards, FX, remittance, and payments. 

  • SMB - Business checking and savings, debit and credit cards, business lines of credit, loans, merchant services, credit card processing, and PoS systems.

  • Enterprise - Commercial checking, financing, real estate, employee benefits, institutional investment, investment banking, securities, and treasury management. 

Original image created by Tom Loverro: https://tomloverro.com/post/102797126721/banking-is-under-attack-heres-a-screenshot-of

Original image created by Tom Loverro: https://tomloverro.com/post/102797126721/banking-is-under-attack-heres-a-screenshot-of

As fintech companies started gaining traction, they largely targeted narrow verticals and customer segments. Here is a good visual representation showing how each fintech company is attacking a very specific product segment that Wells Fargo provides: 

Traditional financial companies are feeling the pressure from large competitors and small fintechs across every single segment and product category they serve.


Developers as the end customers

Financial institutions were built to on-board people as customers (retail) or business owners as customers (SMB); however, today there is a new class of users needing access to the underlying financial infrastructure these banks use - developers.

Developers not only want access to the data (“Open banking”) of financial institutions, but more importantly want access to the underlying functionality that banks provide. 

Prior to fintech platforms, if a developer wanted to start a new fintech company it typically took 2+ years to develop a partnership with a bank before getting up and running. Now we see developers using fintech platforms (ex. SynapseFi, Sila, etc.) to spin up new fintech apps in a matter of hours. This reduction of effort is leading towards a rise in the number of fintech applications in the marketplace. 

Developers as the banks customers.png

My prediction is we will see a further continuation of this trend and the financial infrastructure platforms themselves work across a whole network of financial networks including banks, financial institutions, and up and coming digital wallets. These developer platforms will abstract away all of the complexity of working across multiple financial partners, and allow applications of all types to embed fintech services within their products (both fintech and non-fintech apps).

fintech infrastructure stack

Fintech Infrastructure 

All of the above fintech trends and more are pushing the requirements of fintech platforms, most notably by the developers who are building fintech apps on top of the legacy and next-generation financial infrastructure.

Below is a market map of this new fintech financial infrastructure space:

Fintech Infrastructure Market Map.png


Traditional Financial Institutions

This category includes all of the traditional banks working with fintech companies on a business level (white-label banking), developer level (banking-as-a-service), and the legacy core banking infrastructure providers (FIS, Fiserv, etc). Many of the early adopter banks have been smaller community oriented banks, with the exception of BBVA who developed their platform through the acquisition of Simple. 

Banking-as-a-service Platforms

This category is primarily other startups who are trying to provide the entire functionality of a bank (Deposit, Savings, Send, Withdraw) to developers to allow them to build financial features within their own applications.

Banking as a service API market map.png

Banking Connector API’s

This category is primarily platforms and services that allow users to connect their own bank accounts (Chase, Bank of America, Wells Fargo, Citi) through API’s that developers can embed into their own application.

Lending as a Service

This category are platforms who are proving end-to-end lending solutions which can be embedded within fintech applications or work within lenders & financial institutions. This includes some of the traditional players in addition to new startups offering these services via API.

Lending as a Service Map.png

Card Issuing API - Targeting developers

This category is primarily platforms that allow developers to issue cards (Credit card, virtual cards, and prepaid cards) within their applications to their end users.

Credit Card Issuing API.png

Brokerage Infrastructure API’s

These are API’s that allow developers to offer stock trading & brokerage services within their fintech applications.

Brokerage Infrastructure API’s.png

Other Financial Infrastructure API’s

Here are a few examples of other fintech infrastructure companies allowing developers to build stock trading, marketplace, and other complex forms of payments within their applications.

Other Fintech API's.png

Banks vs. Developers

Many of the tools, API’s, and infrastructure created for financial applications were originally created for internal banking customers; however, now with the rise of consumer and business fintech applications, we are going to see outside developers as the new emerging customer.

Plaid, a fintech infrastructure company recently acquired by Visa for $5.3B, stated in their M&A report that they have 2,600+ fintech developers on the platform. As we see more and more products embedding financial features into their own applications, we’re going to see a huge expansion of “fintech developers” across all market segments and verticals.

Thanks

A big thank you to Charley Ma, Mengxi Lu, Edith Yeung, Jason Choi, David Gogel, and Kim McCann for helping to review and provide feedback on this post.

Appendix

“Future evolution of fintech infrastructure”

Fintech applications are most commonly thought of as being built on top of existing banking systems.

However, as this infrastructure layer is solved there are new banking rails which are still in their infancy - most notably digital assets. This includes Bitcoin, Ethereum, and most interesting of all, the variations of Stablecoins (USDT, USDC, etc.).

Given digital-assets are programmable in nature, many of the first order problems are already solved from day one. Digital assets are stored in a common data layer (the blockchain), with a shared interface (UXTO’s or ERC20’s), and build on inter-operable protocols (assets can be stored among any digital wallets). 

There is a huge open question whether digital-asset first platforms (Coinbase/Binance) will be able to bridge these divides first, or whether traditional fintech apps will move down the digital stack first. 

This cross-section is one of the most interesting areas we are paying attention to closely. 

Digital Asset Fintech Infrastructure.png

Cryptocurrency Data 101: Market Landscape of the Bitcoin & Crypto Data and Analytics Sector

It has been said that the next wave of $1B+ companies in the cryptocurrency sector will be data and analytics firms.

Within this market, I wanted to have a better understanding of all of the data providers within the Bitcoin and crypto sector. Most importantly to better understand all of the various sources people consume data regarding the crypto market.

Unlike the traditional financial markets, most of the underlying data is public within the Bitcoin and cryptocurrency ecosystem. This leads to a unique development where there is a large and growing consumer & institutional demand for data within the cryptocurrency market.

Below is a quick primer on crypto data and an overall landscape into the data & analytics space today. 

Primer on Crypto Data

One of the most interesting things about the crypto space, is the overwhelming majority of data is public. For example, on the Bitcoin network, every single transaction from the beginning of time (genesis block) until now, is recorded on the Bitcoin blockchain.

This includes every transfer between people, between exchanges, to service providers, and to merchants. Any amount of value that has moved from one address to another is recorded for all time on the Bitcoin blockchain. The same is true for most other blockchain networks out there as well: Ethereum, Litecoin, XRP, etc.

Because all data is recorded on the blockchain, this creates an interesting dynamic where all of the most valuable economic data for the $250B cryptocurrency industry, is hiding in plain sight. Unlike the traditional finance system, if you have a question about Bitcoin, you can most likely find the data to answer your question.

Companies within the data and analytics market aim to pull together all of this public data to help participants (consumers, funds, exchanges, miners, etc) make sense of the crypto market. 

Data Sources

Mohamed Fouda lays out that the majority of data about crypto comes from three primary sources:

  1. Exchange Data (Spot markets, derivative markets, OTC)

  2. Blockchain Network Data (block explorers, hashrate, supply schedules, etc.)

  3. Off-Chain Data (github, nodes, clients, community channels)

All of this data is largely public, especially anything recorded on the various Blockchains. The few sources that are not inherently public are:

  • Over the Counter (OTC) trading information

  • Exchanges (spot and derivatives) - Prices, order books, volume information, etc. are largely public however anything to do with user, demographic, or geographic data is more difficult to derive.

  • Off-Chain data is not necessarily public; however, most of the underlying sources are for the most part easy to pull (github, reddit, twitter, telegram, etc.).


Who consumes blockchain data?

Everyone in the crypto ecosystem consumes some form of blockchain data, including but not limited to:

  • Consumers - To check prices of Bitcoin and various cryptocurrencies.

  • Traders - Pulling data to build trading models.

  • Consumers - To confirm transfers via block explorers.

  • Exchanges - Reconciling & tracking the flow of funds.

  • Hedge funds - Pulling data for arbitrage, etc.

  • Institutional investors - Reconciling pricing data for bookkeeping.

  • Miners - Monitoring hashrate & profitability.

  • Regulators - Monitoring suspicious activity.

  • Journalists - Researching the source of truth. 

  • DApp developers - Monitoring app usage and statistics .

Because blockchain data is inherently public, all kinds of participants can now see and utilize the underlying financial & network data within the crypto ecosystem. 

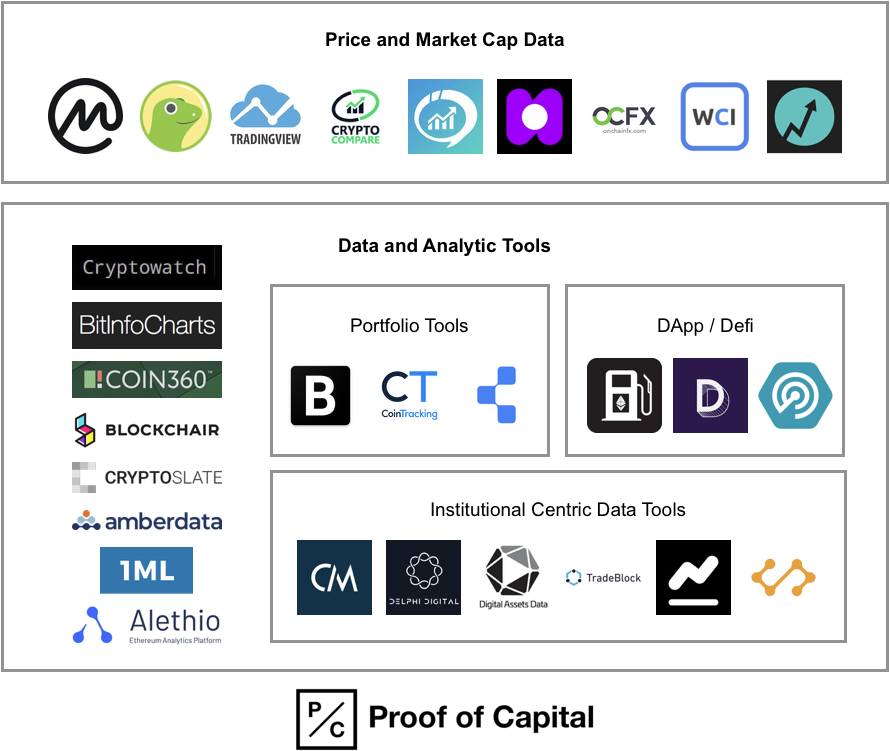
Market Ecosystem Map

Below is an ecosystem map of the data and analytic providers within the whole crypto ecosystem. I also attempted to categorize all of the companies based on the core activities they provide (some of these companies provide many services all in one). 

Please tweet at me @mccannatron if:

  • I missed any major sources of information (particularly regional providers)

  • If you feel I have have mis-categorized any company in particular.

  • If there are any other companies we should consider adding.

The visual market map has a truncated list of companies, with the full listings of all the companies within each category below:

Crypto Data and Analytics Ecosystem Map - Market Cap Providers, Portfolio, DApp, Defi, Insitutional data.png
Crypto Data and Analytics Ecosystem Map - Mining, block explorers, blockchain analytics, media.png

Price & Market Cap Information Providers

Price and market cap providers, provide - you guessed it - price and market cap data of Bitcoin and other cryptocurrencies. 

These services are typically free and public and also expose other surrounding data including volume, supply, charts, exchange data, etc. Since most of these services are public, in my opinion, it’s fair to stack rank them based on the monthly web traffic each service provides. 

Using this metric, the top 5 price & market cap information providers are: CoinMarketCap, TradingView (price & charting), CoinGecko, CryptoCompare, and WorldCoinIndex. See below for the full ranking: 

Bitcoin and Crypto Data Analytics Firms - Coin Market Cap Information Providers Companies.png

Data and Analytic Tools

This is the broad category of providers that seek to pull together basic price/market/network data into more meaningful insights. I further break this broad category into a few specific sub-sectors which I grouped together below. 

Again the majority of these services (except for the institutional centric data services) are primarily public so I am using website traffic to stack rank each company in order.

General Data and Analytic Tools

Here are a few of the companies in this category: 

  • Cryptowat.ch - All in one tool including: market data, exchange API's, monitoring,  portfolio tools, etc. 

  • BitInfoCharts - One of the original analytic services providing many charts and graphs of Bitcoin and all the major cryptocurrencies.

  • Coin360 - Infographics and charts looking at different tokens and exchanges.

  • Cryptoslate - A crunchbase like services highlighting various people, companies, products, and more. 

  • Blockchair - Accumulation of network & market data with charts & API's.

Bitcoin and Crypto Data and Analytics Companies.png

Portfolio Tools

Portfolio tools are products and services that focus on helping people track their overall portfolio of Bitcoin and other crypto assets over time, and through various trades. A few of these services have expanded to also cover tax information as well.

  • CoinTracking - Portfolio tracking and reporting

  • Coinigy - Portfolio management and exchange account management 

  • Blockfolio - Portfolio tracker + communications platform

Crypto Portfolio Trackers - Data and Analytics startups.png

DApp/Defi centric tools

Analytic tools that specialize in areas within the application ecosystem including decentralized applications (dApps), decentralized finance (Defi), and Ethereum services.

Ethereum, defi and dapp analytics companies.png

Institutional Centric Data Tools

These include data and analytic firms that specialize in catering to institutional clients (traditional funds, crypto funds, family offices, etc.).

Most of these services are paid subscription only services, so it’s unfair to stackrank by website data; however, it does give us a relative sense of the most popular services. Also some companies do provide reports via their blog and limited publicly available data.

  • TradeBlock - Data platform for institutional investors 

  • CoinMetrics - Provider of market & network data 

  • Delphi Digital - Boutique institutional-grade analysis on the digital asset market.

  • Digital Assets Data - Full scale data acquisition and application platform for institutions. 

Institutional data providers for bitcoin and cryptocurrencies.png

Mining tools

Mining is one of the most important, although often overlooked aspects of the Bitcoin and crypto ecosystem. Mining information providers include looking at real time hashrate’s of various blockchains, profitability calculators, pool profitability, etc. 

The majority of this data is public. Below is the full stack ranking of each provider. The top three are:

Block explorers

Block explorers are the source of truth for network data. 

From a consumer standpoint, people typically use block explorers to confirm & track transactions. On Ethereum you can also use them to verify tokens/supply information and track dApp transactions as well. From a business standpoint, you can also query data directly from the underlying blockchains (via full node) or use block explorers to aggregate directly from the blockchain. 

Below are the largest block explorers (in terms of viewership) with the top 3 being:

  • Blockchain Explorer - Bitcoin & Ethereum explorer offered by blockchain.com

  • Etherscan - Ethereum centric block explorer

  • BTC.com - Bitcoin block explorer with various mining pools overlaid on top of block data 

Blockchain Analytics Firms

These are firms that specialize in collecting and analyzing transaction data across Bitcoin and other crypto networks. The most typical use-cases are for Governments, exchanges, and financial firms, to track suspicious activity. 

All of these firms analysis’ are private so public website data can only give us a sense on the most used services. 

  • Chainalysis - Prevent, detect, and investigate crypto compliance violations. 

  • Eliptic - Blockchain analytics for regulatory compliance 

  • Crystal - Analytics for due diligence and compliance

  • Anchain - Analytics for threat detection & threat intelligence. 

Blockchain analytics compliance aml investigation tools startups.png

Media

I included media here as well because the media plays an important role in synthesizing market & network data to all of the participants in the crypto ecosystem. Further, outside of price, this is one of the main forms people take to consume information within the crypto ecosystem. 

Below are the media sites stackranked by website views, with the top five media publications being:

  • CoinDesk - Blockchain news and events. 

  • Cointelegraph - Crypto news and analysis 

  • CCN - Market update and crypto news. 

  • NewsBTC - Bitcoin news and analysis

  • The Block - Crypto news which shares a lot of great original analysis 

Geographic Analysis

While trying to understand all of the places people consume blockchain data & analysis, one of the interesting byproducts is also a high level overview of the geographic dispersion of the crypto industry.

Unlike previous innovation cycles, the crypto industry was global from day one. While looking at the top 3 geographic sources for all of these services above, here is one look at where the crypto industry is located: 

Crypto industry location by geographic location.png

Even though the United States is one major center of the crypto industry, it is by no means the only major geographic the industry is located in.


My Key Takeaways

After looking into the total landscape of all the various data providers in the Bitcoin and cryptocurrency sector, here are my biggest takeaways: 

  • Because the core blockchain data is inherently public, the whole ecosystem has a much greater level of access to data (vs. traditional finance).

  • There is a large and growing consumer demand for data and information within the crypto ecosystem.

  • We will likely see large companies built on both the consumer end of the spectrum and institutional end of the spectrum.

  • Yahoo Finance alone has 170M monthly views on their homepage, so we still have some time before the “crypto to finance flippening”. 

If you are an entrepreneur working in this space building unique data services with the crypto industry, I’d love to chat with you. My contact info is listed on our fund website: Proof of Capital.